


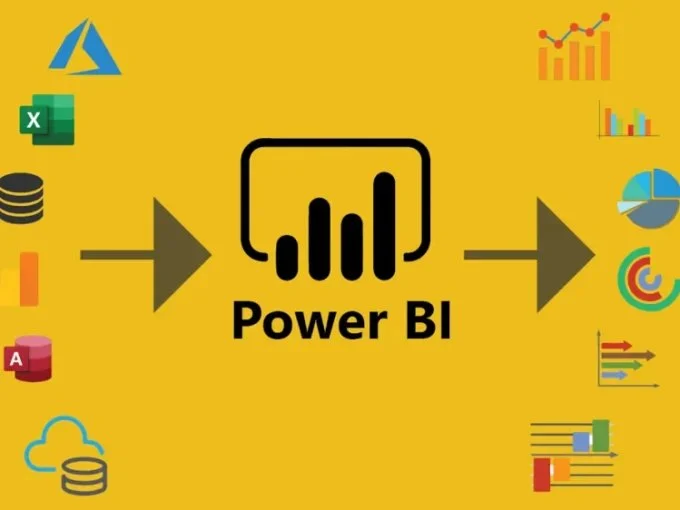
Microsoft Power BI
About Course
Learn Microsoft Power BI from the fundamentals to advanced data analytics and business intelligence concepts. This course covers Power BI Desktop, data importing, Power Query, data cleaning and transformation, data modeling, relationships, DAX, calculated columns and measures, and interactive report and dashboard creation. You’ll learn how to transform raw business data into meaningful insights and visually compelling reports.
Duration: 35-40 Hours
Category: Coding/Development
Skill Level: Beginner – Intermediate
Modules: 24
Subjects & Expertise
With expertise in Microsoft Power BI and business intelligence, the training focuses on data preparation, modeling, visualization, DAX, dashboard development, and analytical reporting. Learners will understand how Power BI can be used to transform complex datasets into meaningful business insights and interactive decision-making tools.
The course combines instructor-led sessions with hands-on labs, real-world datasets, practical assignments, and dashboard projects. Students gain practical experience in connecting data sources, cleaning and transforming data using Power Query, creating relationships and data models, writing DAX calculations, and developing professional Power BI reports.
Modules
1.Power BI Architecture
- Power BI Ecosystem
- Power BI Service
- Desktop
- Gateway
- Licensing
2. Data Modeling Fundamentals
- Star Schema
- Snowflake Schema
- Fact Tables
- Dimension Tables
- Relationships
3. Power Query
- Data Extraction
- Data Transformation
- M Language Basics
- Query Folding
4. Advanced Power Query
- Parameters
- Functions
- Data Cleansing
- Performance Optimization
5. DAX Fundamentals
- Calculated Columns
- Measures
- Context
- Filter Context
- Row Context
6. Advanced DAX
- CALCULATE
- Variables
- Time Intelligence
- Ranking Functions
- Optimization
7. Data Modeling Best Practices
- Relationship Design
- Bridge Tables
- Many-to-Many Relationships
8. Enterprise Reporting
- KPI Dashboards
- Executive Reports
- Drill Through
- Bookmarks
9. Advanced Visualizations
- Custom Visuals
- Tooltips
- Field Parameters
- Dynamic Reports
10. Performance Tuning
- Performance Analyzer
- DAX Optimization
- Model Optimization
11. Incremental Refresh
- Partitioning Concepts
- Incremental Refresh Setup
- Large Dataset Handling
12. Power BI Service
- Workspaces
- Apps
- Deployment Pipelines
- Subscriptions
13. Security
- Row Level Security
- Object Level Security
- Workspace Security
14. Power BI Administration
- Governance
- Tenant Settings
- Usage Metrics
- Monitoring
15. Dataflows
- Dataflows Gen1
- Dataflows Gen2
- Reusable Data Preparation
16. Fabric Fundamentals
- Microsoft Fabric Overview
- Lakehouse
- Warehouse
- Semantic Models
17. SQL for Power BI
- Views
- Stored Procedures
- CTEs
- Window Functions
18. Python and Power BI
- Python Visuals
- Data Processing
- Advanced Analytics
19. Real-Time Analytics
- Streaming Datasets
- Real-Time Dashboards
- Alerts
20. CI/CD and DevOps
- Git Integration
- Deployment Pipelines
- Version Control
21. Industry Use Cases
- Finance Dashboards
- Sales Analytics
- Supply Chain Analytics
- HR Analytics
22. Capstone Project
- Enterprise Data Model
- Executive Dashboard
- Performance Optimization
- Security Implementation
23. Interview Preparation
- Scenario Based Questions
- DAX Challenges
- Architecture Discussions
24. Best Practices
- Documentation
- Dashboard Standards
- Production Support
- Troubleshooting